Python
The Python interface to SENSUS is provided entirely by the SENSUS SDK package.
When you install the SENSUS SDK Python wheel (.whl), you are installing:
- The Python bindings
- The native
sensus-sdkruntime libraries- CPU support (always included)
- CUDA support (if using the CUDA build)
The remainder of this page assumes you have followed all steps on the Installation page and have the following ready:
- A system with:
- Python 3.10 or newer
- Calyo SENSUS SDK
- Calyo SENSUS 3RDPARTY
- An activated Python virtual environment (recommended)
⚠ Virtual Environments
Installation inside a virtual environment is strongly recommended and assumed throughout this page. The sensus-sdk package must be installed separately in each virtual environment where SENSUS is used. You can verify installation in the active environment with:
pip list | grep sensus
Integrating the Wrapper
Once the SENSUS SDK is installed, you can access the Python interface through the sensus module.
- Create a new Python script.
- Import the
SensusSTclass and any helper functions you need. - Initialise a
SensusSTinstance with your desired configuration and backend ('CUDA'if GPU acceleration is available, otherwise'CPU').
from sensus import SensusST, load_yaml_as_string
config = load_yaml_as_string("<path-to-config.yaml>")
pulse = SensusST(config, 'CUDA') # init with 'CPU' if GPU not available
See the examples below for typical usage patterns with the SENSUS Python integration.
SensusST stands for 'Single Threaded'. There is a multi-threaded version, SensusMT, which can provide asynchronous functionality without blocking the calling thread.
Examples
The following examples demonstrate common uses of the SENSUS SDK. Some examples require additional Python packages such as numpy and matplotlib, so ensure these are installed in your environment before continuing:
pip install numpy matplotlib
2D Intensity Map
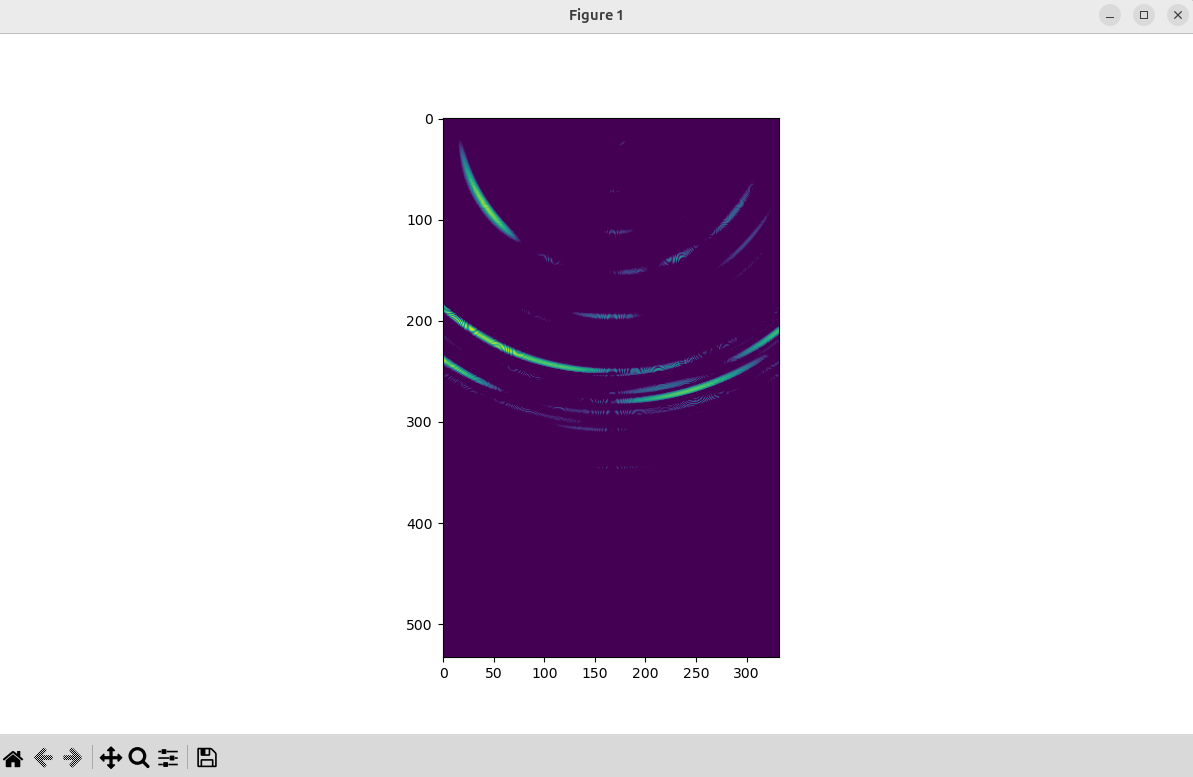
This example demonstrates how to capture a live PULSE frame, convert the data into Python structures, and visualise it as a 2D intensity map.
Create a YAML file in your Python project called sensuspython-2dexample.yaml containing the following configuration:
Click to view sensuspython-2dexample.yaml
type: calyosensus
pipelines:
  - id: imager_2d
    reader:
      type: DeviceReader
      serial_number: any
      num_cycles: 20
      max_distance: 8
    writer:
      type: FrameBufferWriter
    processor:
      type:
        stage: log_conversion
        imaging_options:
          algorithm: resolution
          dimensions: 2
      runtime_parameters:
        roi:
          coordinateSystem: 0 # cartesian
          cartesian:
            xMin: -2.5
            xMax: 2.5
            zMin: 0
            zMax: 8
            pixelSize: 0.015
          polar:
            rMin: 0
            rMax: 8
            azMinRads: -1.5707
            azMaxRads: 1.5707
        threshold:
          db:
            enabled: true
            scale: -15
Then create a Python script in the same directory with the following:
from sensus import SensusST, load_yaml_as_string
from pathlib import Path
import numpy as np
import matplotlib.pyplot as plt


# Load the config file from the script directory, extract the YAML,
# and initialise a SensusST object, setting the backend to 'CUDA'
path = Path(__file__).parent / "sensuspython-2dexample.yaml"
pulse = SensusST(load_yaml_as_string(path), 'CUDA')

# Finished early indicates failure to initialise
if pulse.finished():
    print(pulse.flush_logs())
    raise RuntimeError("Failed to initialise")

# Flush logs to find out what's going on
print(pulse.flush_logs())

# Run the sensor for one frame and flushing out the packets
# from the frame buffer to a list
packets = pulse.acquire_single_frame()

print(f"Received {len(packets)} packets!")

# Based on the config, a single pipeline should output a single packet of type 'Mat2'
if (len(packets) == 1):
  p = packets[0]
  print(p['type'])

  # get image dimensions from the packet
  row = p['rows']
  cols = p['cols']

  # cast the data to a numpy array
  intensity_map_packet = np.array(p['data'])

  # plot the image with matplotlib
  fig = plt.figure(figsize=(12,7))
  ax = fig.add_subplot()
  image = np.reshape(intensity_map_packet, (row, cols))
  im = ax.imshow(image)
  plt.show()
View expected output
Capture raw signal data (XML)
In many applications, storing the raw bytes from the sensor can be beneficial, as it enables refinement of the SENSUS parameters after data capture, as if the sensor were operating live.
This approach allows for post-capture analysis and calibration of the PULSE sensor, while keeping the overall data footprint relatively small. It also opens the door to advanced use cases, such as direct analysis of the raw acoustic signals by reconstructing them from the stored bytes.
To achieve this, create a YAML file in your Python project called sensuspython-signalcapture-example.yaml containing the following configuration:
Click to view sensuspython-signalcapture-example.yaml
type: calyosensus
pipelines:
  - id: datacapture_xml
    reader:
      type: DeviceReader
      serial_number: any
      num_cycles: 20
      max_distance: 8

    writer:
      type: XMLWriter
      output_path: ./sensuspython-signalcapture-example-data

    processor:
      type:
        stage: passthrough
Please replace
output_path: ./sensuspython-signalcapture-example-datawith your desired path to store your dataset.
Then create a Python script in the same directory with the following:
from sensus import SensusST, load_yaml_as_string
from pathlib import Path

# Load the config file from the script directory, extract the YAML,
# and initialise a SensusST object, setting the backend to 'CPU'
path = Path(__file__).parent / "sensuspython-signalcapture-example.yaml"
pulse = SensusST(load_yaml_as_string(path), "CPU")

# Finished early indicates failure to initialise
if pulse.finished():
    print(pulse.flush_logs())
    raise RuntimeError("Failed to initialise")

# Flush logs to find out what's going on
print(pulse.flush_logs())

# Capture 20 frames
for i in range(20):
    pulse.acquire_single_frame()
    print(f"Captured frame {i+1}")

print("Capture complete")
Example CLI App
Coming soon